 © Ram Brij
The SCALE Framework
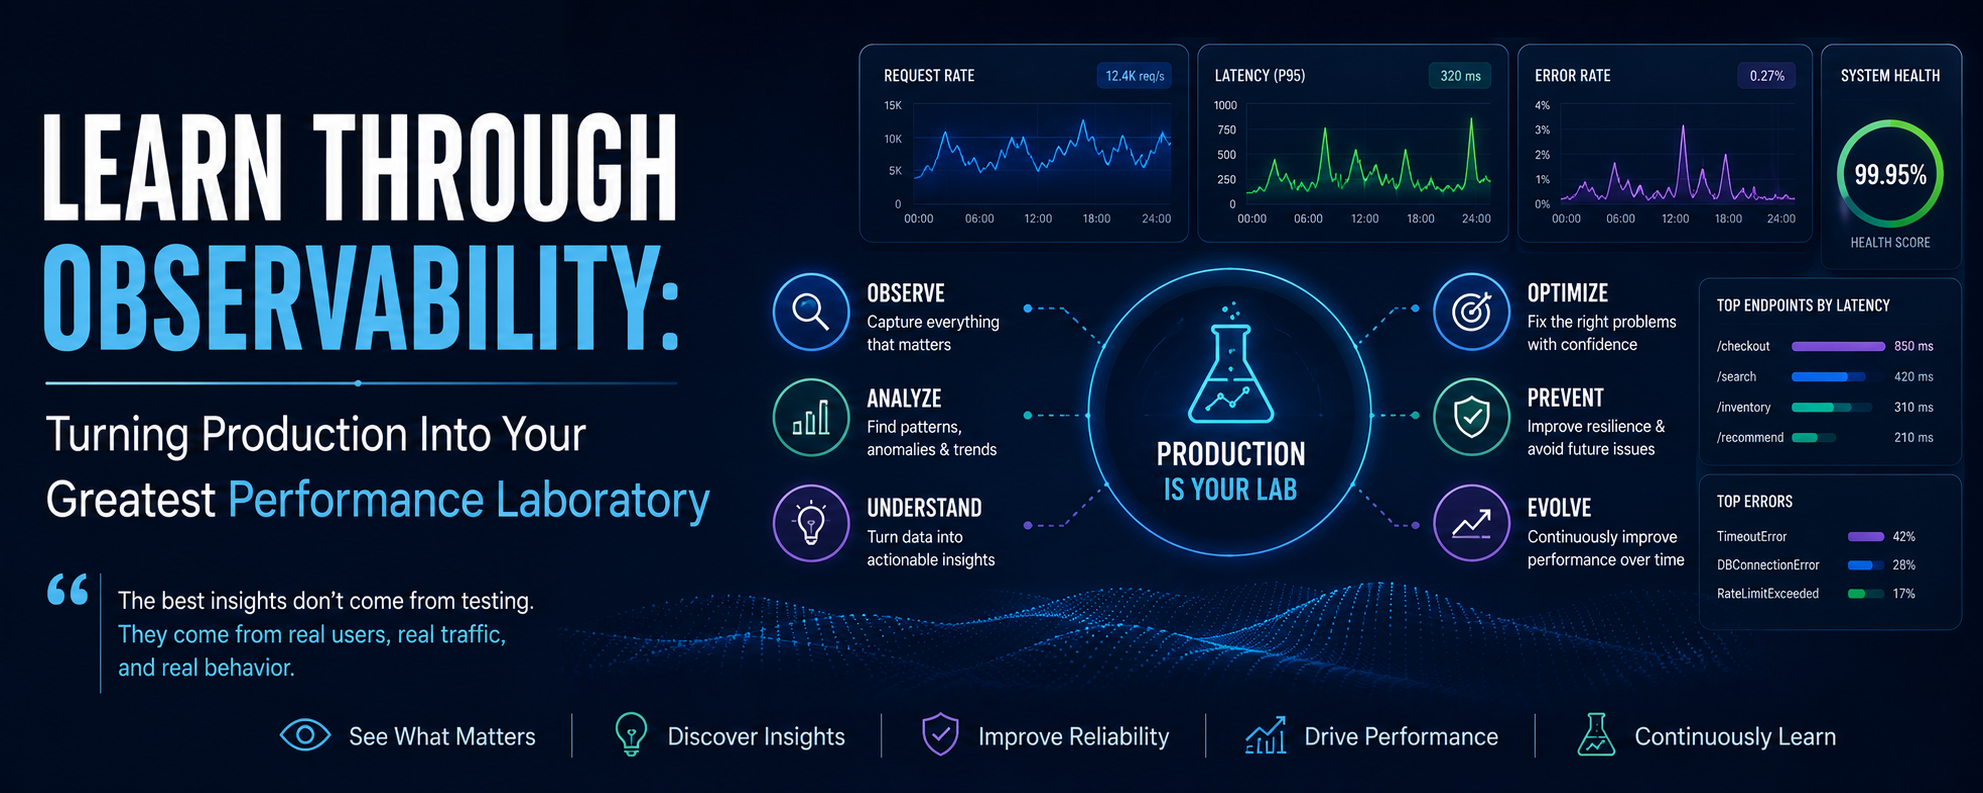
Learn Through Observability: Turning Production Into Your Greatest Performance Laboratory
📘 About this Series
The SCALE Framework Series explores the SCALE Framework, an original methodology for Continuous Performance Engineering developed by Ram Brij through years of enterprise software engineering and technology leadership. Each article builds on the previous one, gradually introducing the framework's philosophy, principles, and practical implementation.
You're reading: Part 7 – Learn Through Observability: Turning Production Into Your Greatest Performance Laboratory
Learn Through Observability
Turning production into your greatest performance laboratory
For much of software engineering history, production has been treated as the finish line. Teams design a solution, build it, test it, deploy it, watch it for a few days, and move on to the next project. Once the application reaches production, the assumption is that the engineering work is basically done anything that shows up afterward gets filed as an operational concern rather than a chance to improve the system itself.
That made sense when software moved slowly. Releases were infrequent, architectures stayed fairly stable, and production incidents were relatively rare, isolated events. Monitoring existed mostly to alert operations when something broke, so engineers could restore service as fast as possible.
Modern software has changed that relationship completely. Cloud-native systems evolve constantly. New services ship every day. Infrastructure scales itself. Customer behavior shifts without warning. Third-party APIs change on their own schedule. AI components can shift behavior without anything resembling a traditional release. Under those conditions, production stops being the final stage of delivery it becomes the place where your engineering assumptions get tested against reality, continuously.
Every architectural decision eventually reaches production. Every optimization meets real customer behavior. Every scaling strategy runs into workloads that no pre-production environment could fully reproduce. Production doesn't just reveal failures, it reveals whether the assumptions made during architecture, development, and validation are still holding up under conditions that keep changing.
That realization gradually changed how I thought about observability. Early in my career, I associated it mostly with dashboards, log files, and troubleshooting incidents. Over time I came to see those tools as just the visible surface of something bigger. Their real value isn't helping engineers recover from failure, it's helping them learn from every successful request, every unexpected traffic pattern, every latency spike, and every slow trend that builds up over time.
That shift in perspective is the fourth principle of the SCALE Framework: Learn Through Observability.
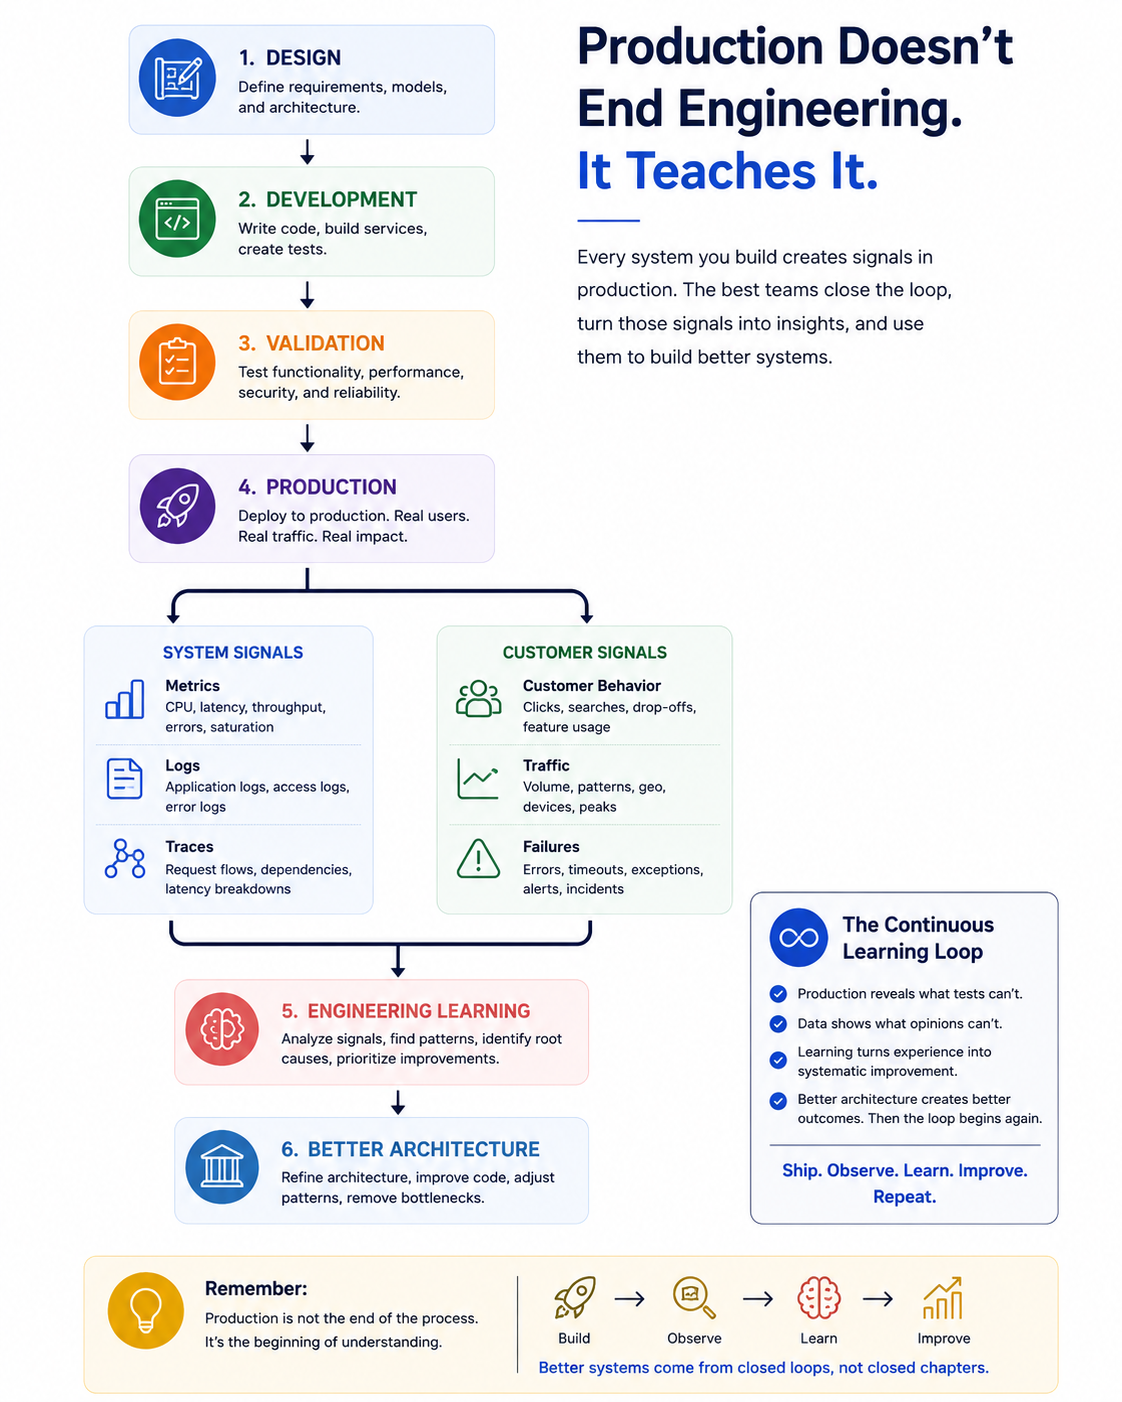
Observability isn't just an operational capability. It's an engineering feedback system. Its job isn't only to answer "what happened," but to help engineers understand why it happened, whether it was expected, and what should change in the next version of the system. Production isn't where engineering ends. It's where engineering starts learning again.
Metrics tell you that something changed
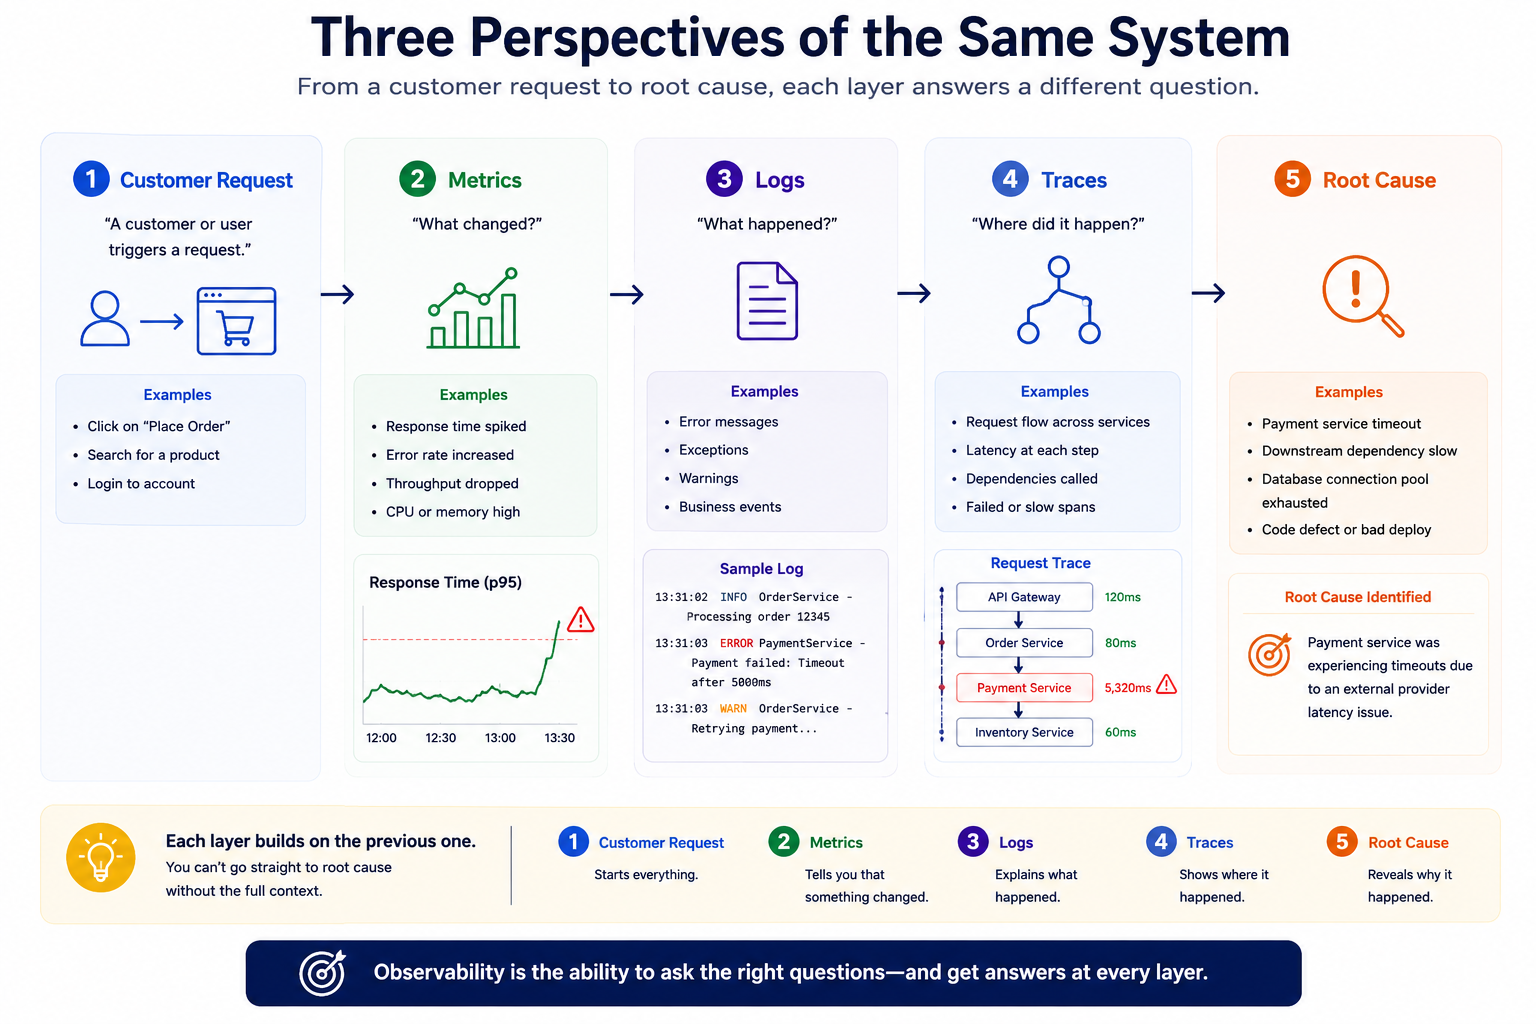
One of the first things engineers learn to watch is metrics, CPU utilization, memory consumption, request latency, throughput, error rates, queue depth. These become familiar dashboards fast because they give you a high-level read on system health. Metrics are great at answering "has something changed?" They surface trends, flag unusual behavior, and are often the first sign that a system is drifting from expected performance.
Where they fall short is explaining why it changed. A dashboard showing API latency up 30% tells you something needs attention, it doesn't tell you whether the cause is a slow database query, a network dependency, an infrastructure change, or a shift in customer behavior.
That distinction matters, because teams sometimes mistake monitoring for observability. Monitoring watches for predefined conditions and known failure modes. Observability goes further, letting engineers investigate situations nobody anticipated when the system was designed. So metrics are the start of an investigation, not the end of one they flag symptoms, establish trends, and quantify customer impact. Within SCALE, metrics are one of the earliest signals that an engineering assumption deserves a second look.
Logs capture the story behind every request
If metrics tell you something changed, logs start explaining what actually happened. Every request that hits your application leaves a trail: authentication succeeds or fails, business rules get evaluated, database queries run, external services respond, exceptions get raised. Together, those events tell the story of how the application behaved at a specific moment.
Well-designed logs turn a production system into a searchable engineering journal. Instead of just recording technical events, they carry enough context to reconstruct customer journeys, explain unexpected behavior, and surface patterns that would otherwise stay invisible.
The hard part isn't generating more logs modern distributed systems already produce terabytes of them daily. The hard part is generating logs that explain intent, not just execution. Good logs let you answer questions like:
Which business operation was being performed?
Which dependency failed?
What decision path was taken?
Which customer journey was affected?
Design logs around those questions, and they stop being a pile of timestamped messages and start being evidence that supports real engineering learning.
Traces reveal relationships metrics can't
Distributed architectures introduce a different kind of problem. A single customer request might pass through an API gateway, an authentication service, a recommendation engine, an inventory service, a payment processor, a notification system, and several databases before it ever returns a response.
Looking at each service's metrics in isolation often hides the real issue. Looking at every service's logs individually quickly becomes overwhelming. Distributed tracing solves this by reconstructing the full journey a request took instead of examining services one at a time, engineers can see the entire execution path, spot exactly where latency piled up, identify which dependency introduced the delay, and watch how a failure propagated through the system.
That capability changes root-cause analysis at a fundamental level. Instead of asking which service looks unhealthy, you start asking which interaction actually produced the customer experience you observed. It's a subtle shift, but it moves troubleshooting from individual components to the behavior of the system as a whole.
OpenTelemetry: a common language for observability
As organizations pick up more programming languages, cloud platforms, and monitoring tools, a familiar problem shows up: observability data gets fragmented. Metrics live in one platform, logs in another, traces somewhere else entirely each with its own format and conventions. Correlating all of it together gets hard exactly when you need it most.
OpenTelemetry addresses this by giving teams a vendor-neutral standard for collecting, correlating, and exporting telemetry data. It doesn't replace your existing monitoring platforms it gives metrics, logs, and traces a common language to work in together.
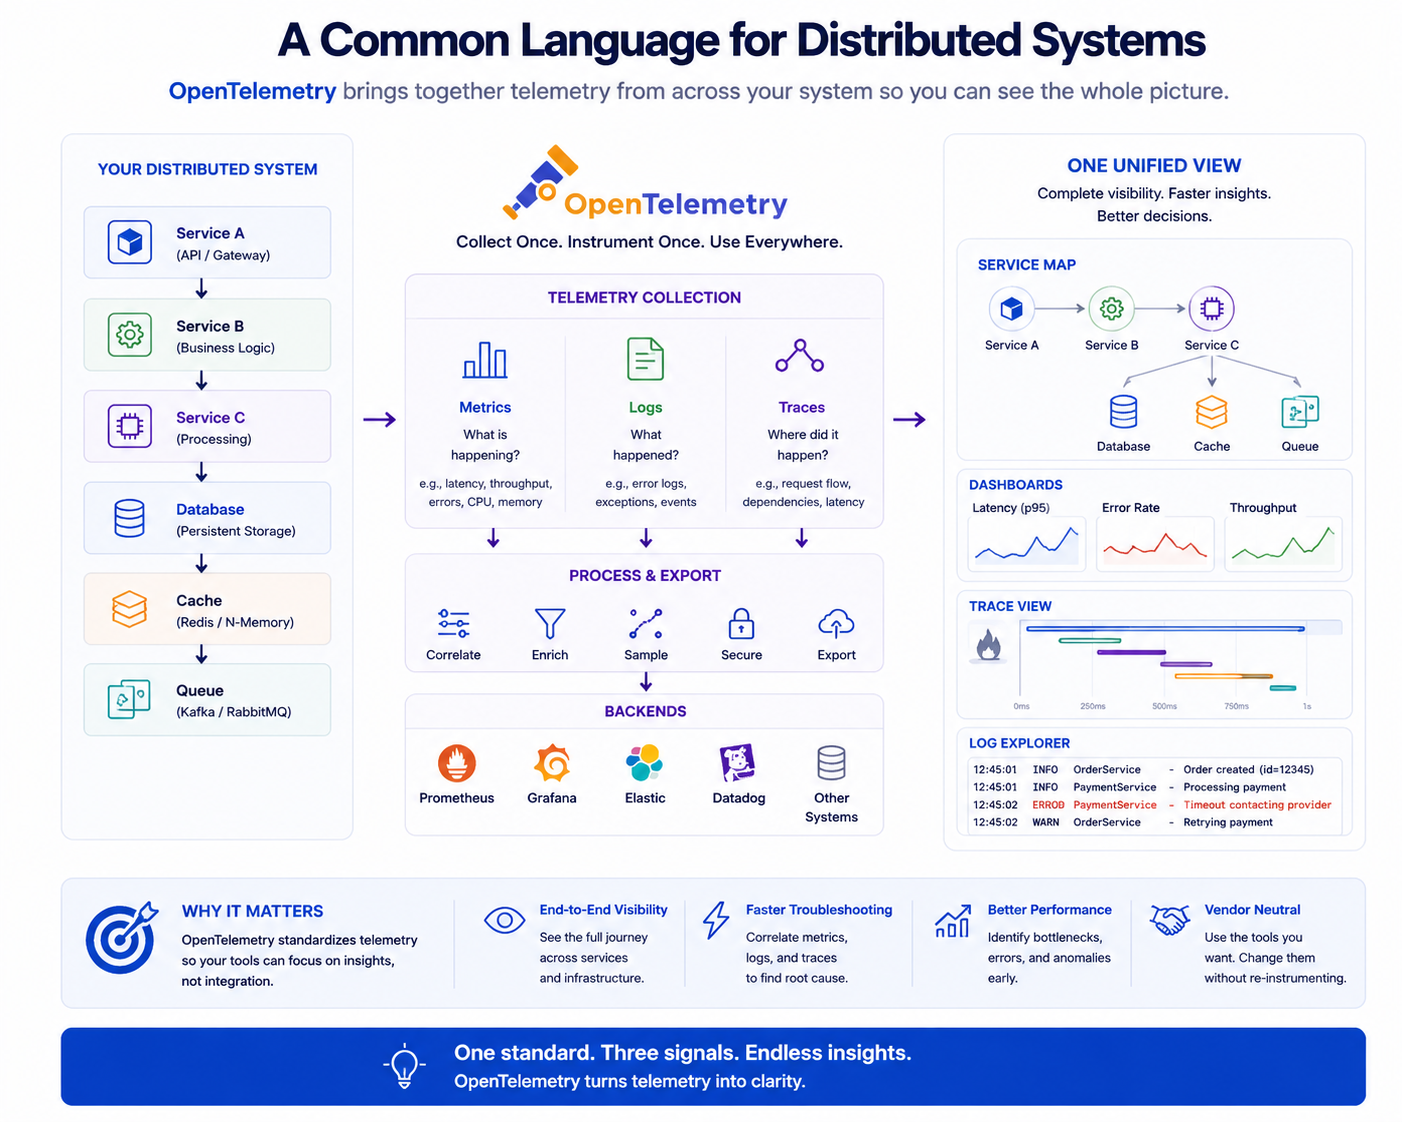
For teams practicing Continuous Performance Engineering, that consistency matters because learning depends on connecting information across the whole system. A latency spike should be traceable back to the request that caused it, the logs around it, the infrastructure metrics at that moment, and the customer impact without an engineer manually stitching the story together by hand. A standard alone doesn't create observability, but it removes a lot of the friction that keeps organizations from actually learning from production.
Measuring reliability through SLOs, SLIs, and error budgets
A lot of organizations still measure success by whether the application is up. Modern engineering teams increasingly measure success by whether the application consistently meets what customers actually expect from it.
Service Level Indicators (SLIs) quantify the experiences that matter request latency, availability, throughput, successful transactions. Service Level Objectives (SLOs) set the target the engineering org commits to hitting. Error budgets round this out by accepting something important: perfection isn't achievable, and chasing it isn't even desirable. Instead of demanding 100% availability, teams define an acceptable level of risk that leaves room for innovation while still protecting the customer experience.
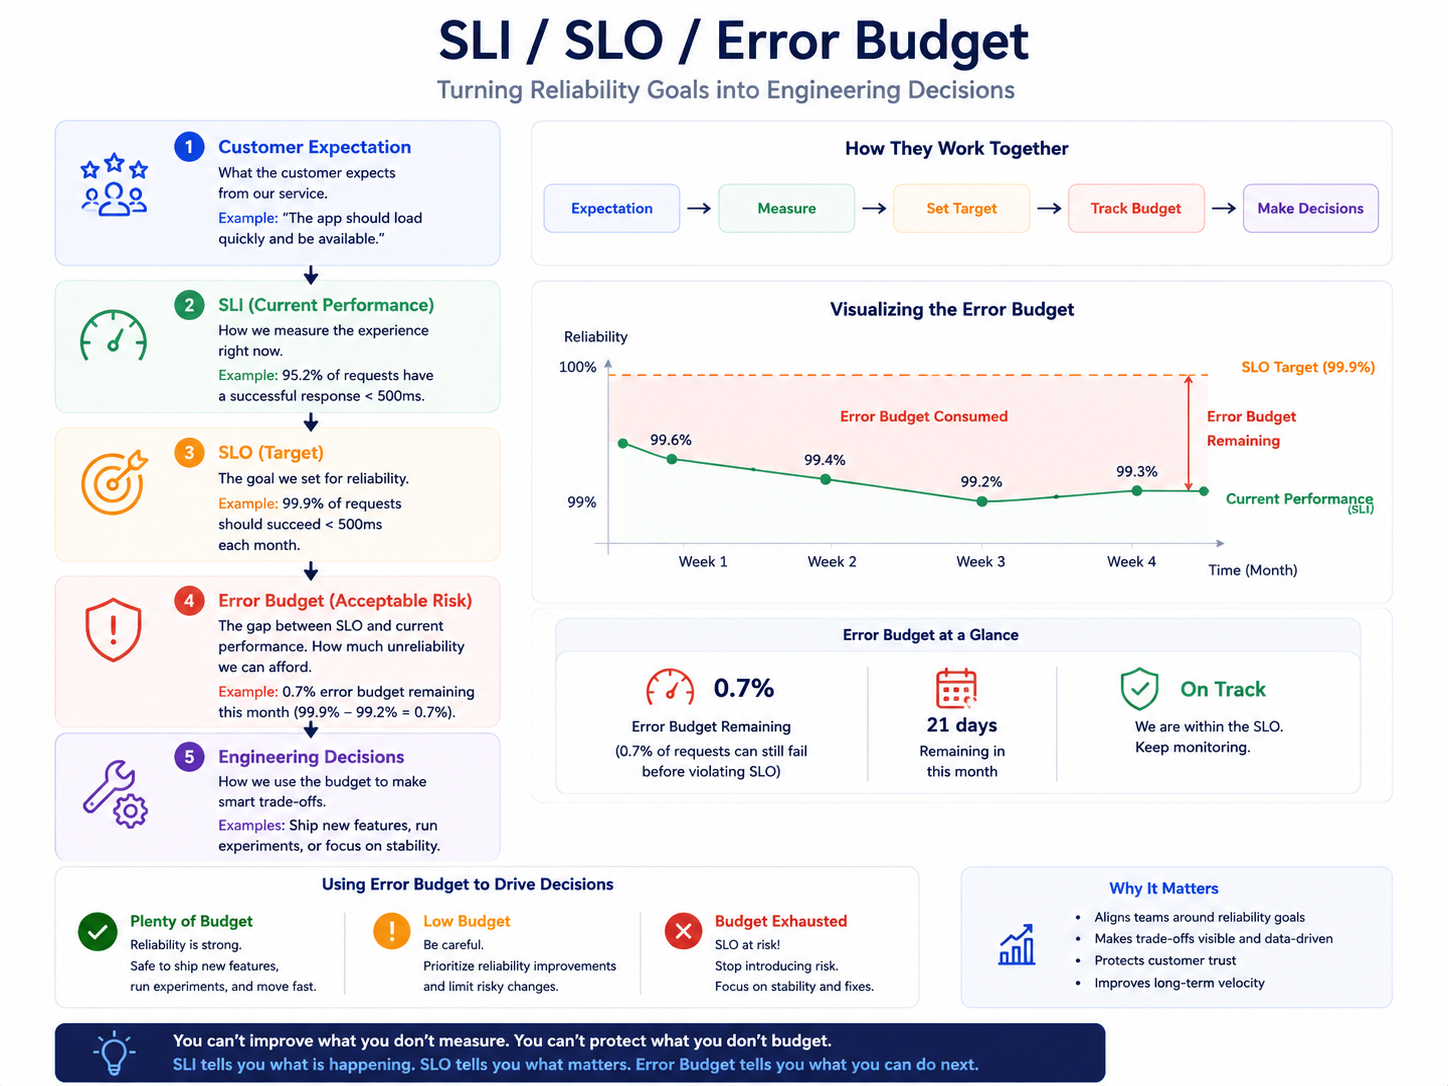
This changes the conversation. Instead of arguing over isolated incidents, teams check whether the system is still operating within its agreed reliability target. Engineering decisions start getting guided by measurable outcomes instead of gut feeling.
Production is your greatest root-cause analyst
Root-cause analysis usually gets associated with big incidents, but some of the most valuable engineering insight comes from systems that never have a dramatic failure at all. Small latency creeps, gradual memory growth, shifting customer behavior, changing traffic patterns these often expose architectural limits long before anything actually goes down.
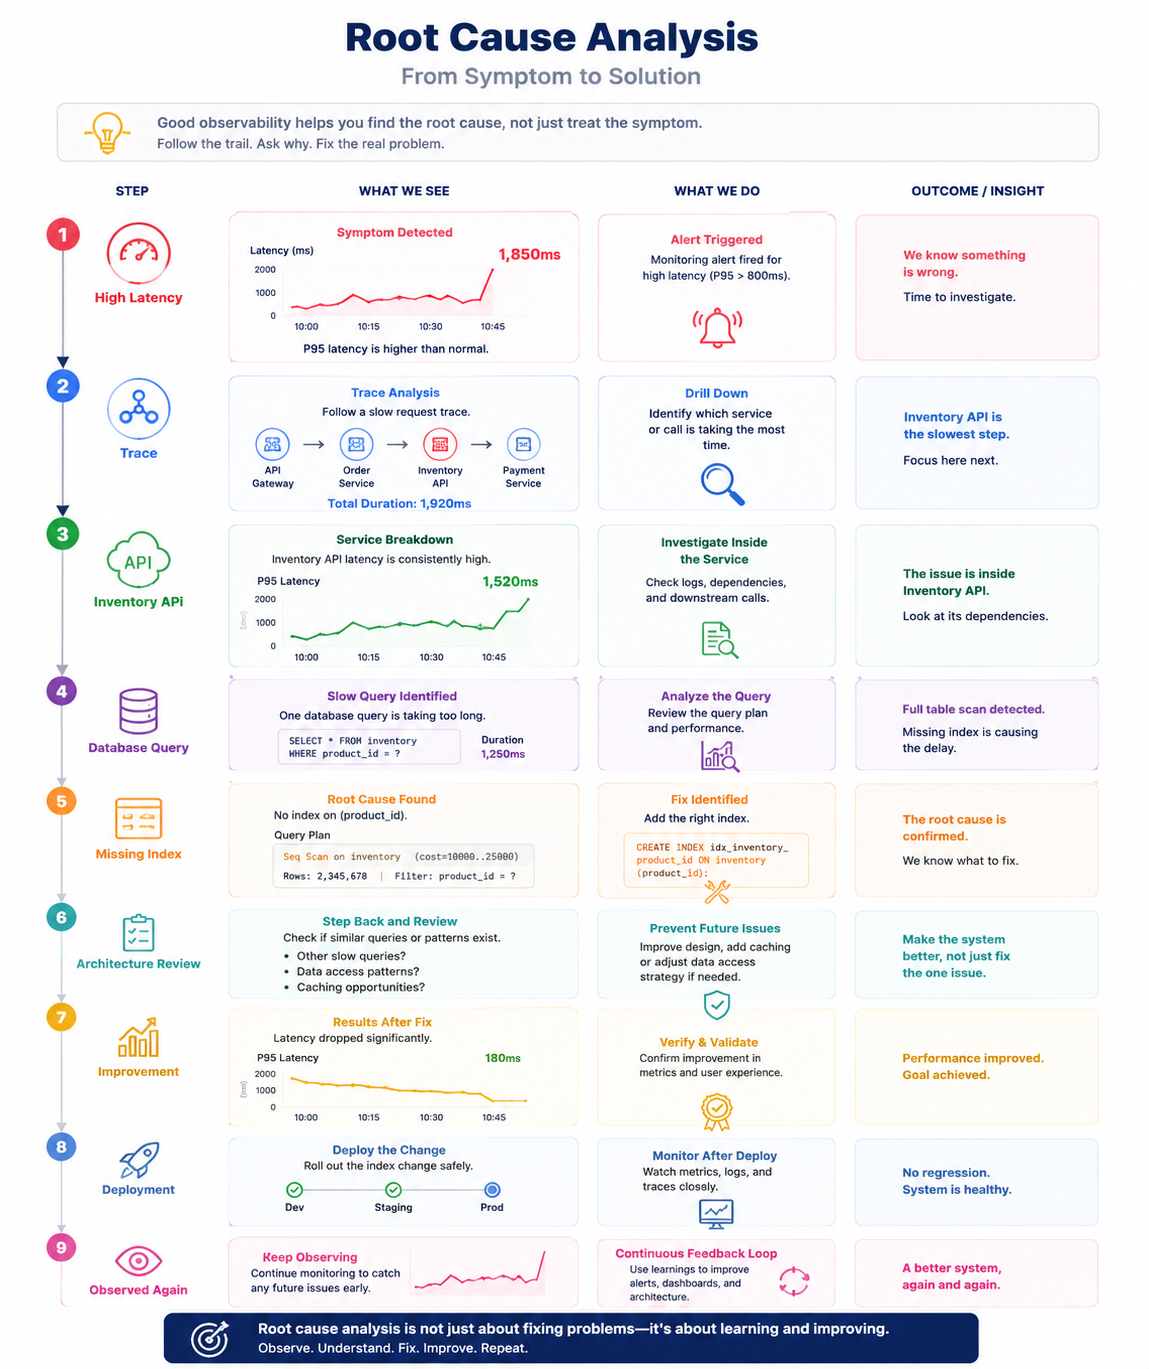
The most mature engineering teams treat every unexpected production behavior as a chance to understand the system better. Instead of only asking "what failed," they ask which assumption turned out to be wrong, which architectural decision is worth revisiting, and what production just taught them that testing never could. That reframing is what turns observability from a troubleshooting activity into a genuine engineering discipline built around continuous learning.
Enterprise perspective
One of the more useful lessons I've picked up leading enterprise platforms is that stable production environments don't get that way because engineers stop making changes. They get that way because teams keep learning from every change they make.
I've seen situations where the dashboards looked completely healthy while customers were reporting inconsistent response times. Traditional monitoring showed nothing obviously wrong with the infrastructure. It took combining traces, logs, business metrics, and customer journey analysis together to find the actual issue: a rarely executed workflow was causing intermittent latency that only hit a small percentage of requests. But those particular requests belonged to a critical business process, so the impact was way out of proportion to how often it actually happened.
The fix didn't come from adding another dashboard. It came from asking better questions about what production was already trying to tell us.
Closing the feedback loop
Observability only pays off fully when what you learn actually changes future engineering decisions. Every insight from production should feed back into architecture reviews, capacity planning, performance budgets, deployment strategy, and what gets prioritized next. When production keeps informing design this way, engineering teams gradually trade assumptions for evidence.
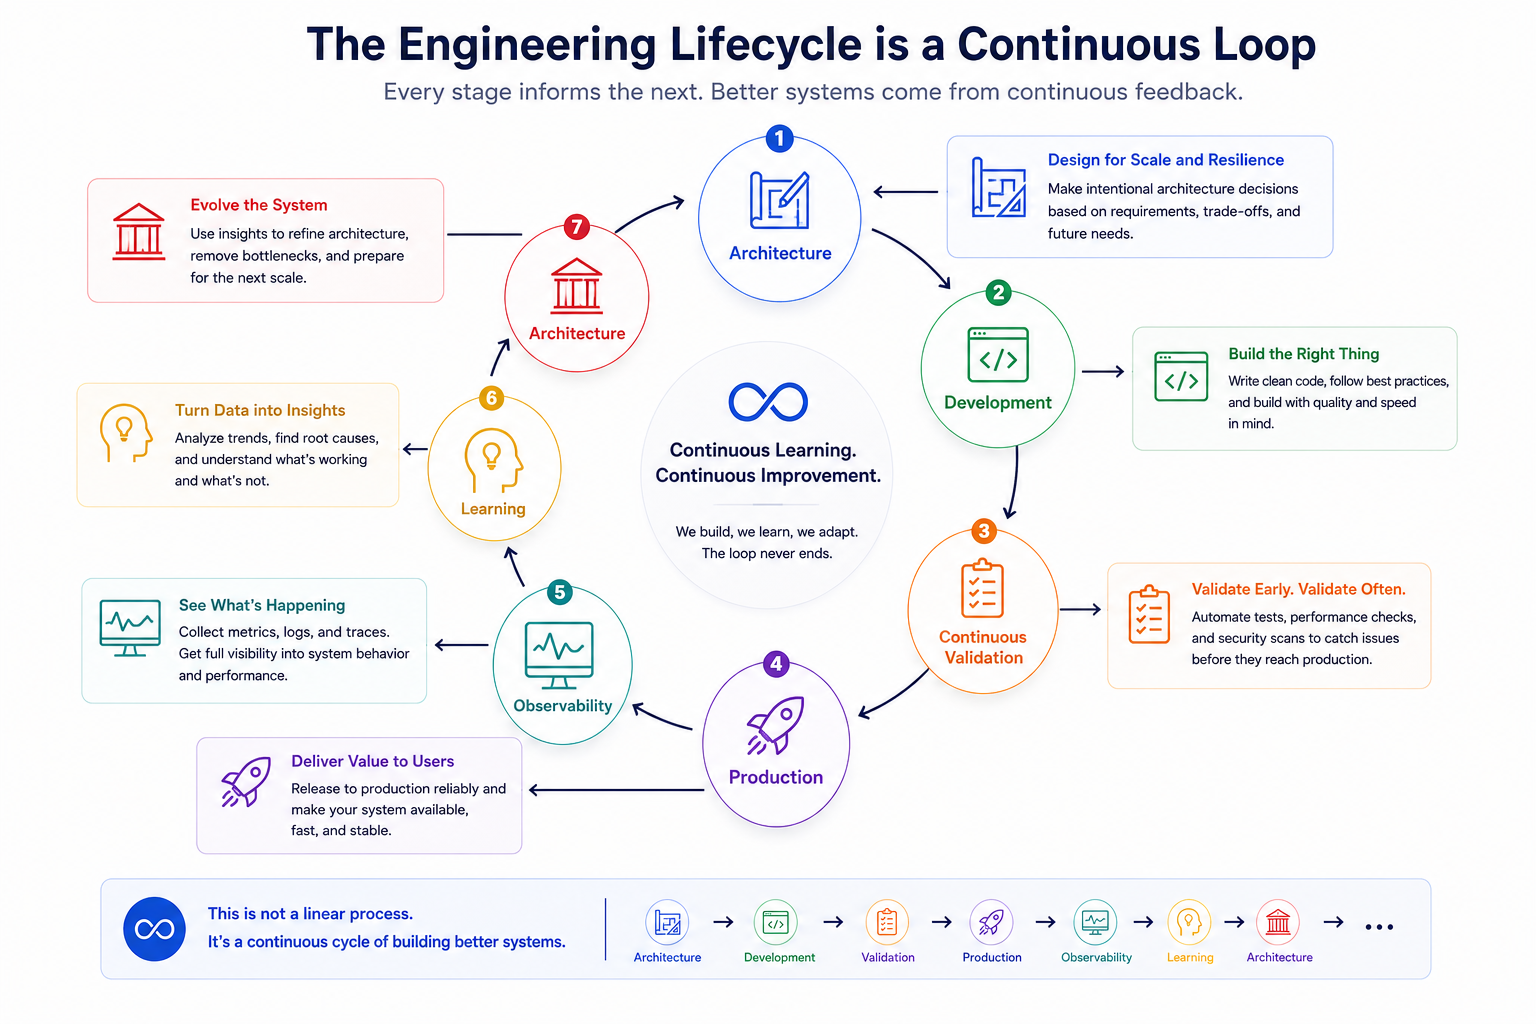
Within SCALE, this closes an important loop: architecture sets the expectations, Continuous Validation builds confidence in them, observability tests those assumptions against reality, and what you learn from that feeds directly into the next round of architecture. That loop, running continuously, is how engineering organizations end up with systems that keep getting more resilient, more scalable, and more performant over time — not by accident, but because production never stops teaching them something.
Engineering takeaways
Metrics reveal that behavior has changed.
Logs explain what happened.
Traces show how requests flowed through distributed systems.
OpenTelemetry creates a unified observability language.
SLOs and SLIs align engineering with customer experience.
Error budgets balance innovation with reliability.
Production is the richest source of engineering knowledge.
Learning only creates value when it changes future engineering decisions.
SCALE Insight
Production isn't where engineering ends. It's where engineering assumptions meet reality. Observability turns that reality into continuous learning, and continuous learning is what lets systems keep improving long after they've been deployed.
Next in the SCALE Framework Series
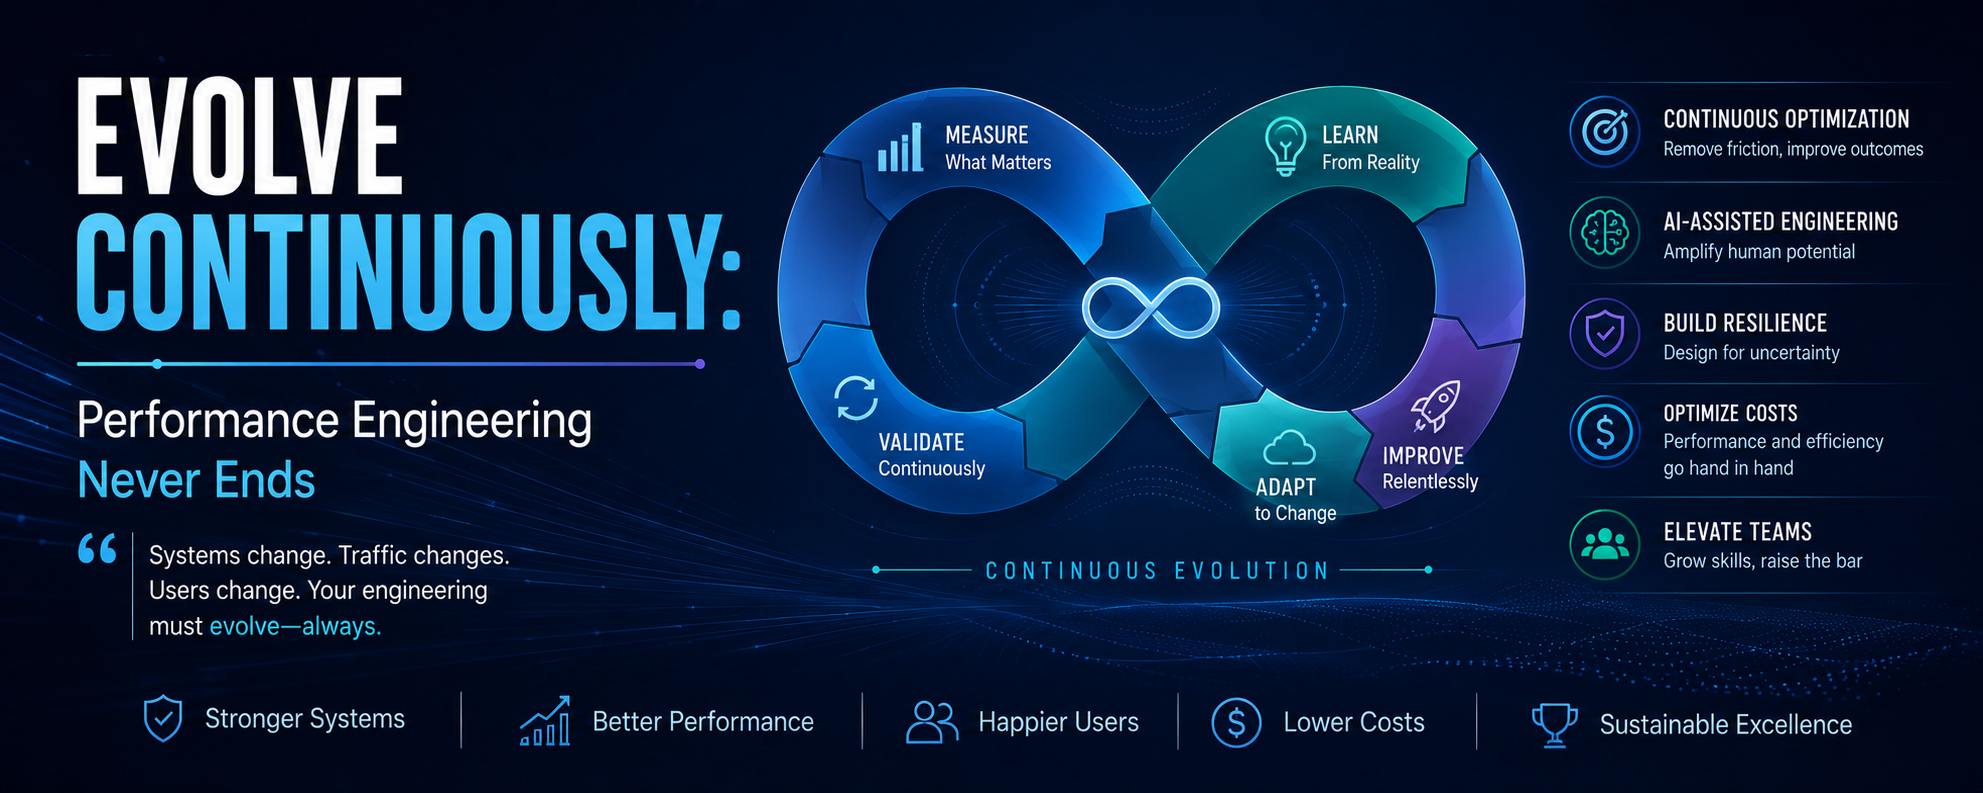
Article 8 – Evolve Continuously: Performance Engineering Never Ends
Previous read
The SCALE Framework
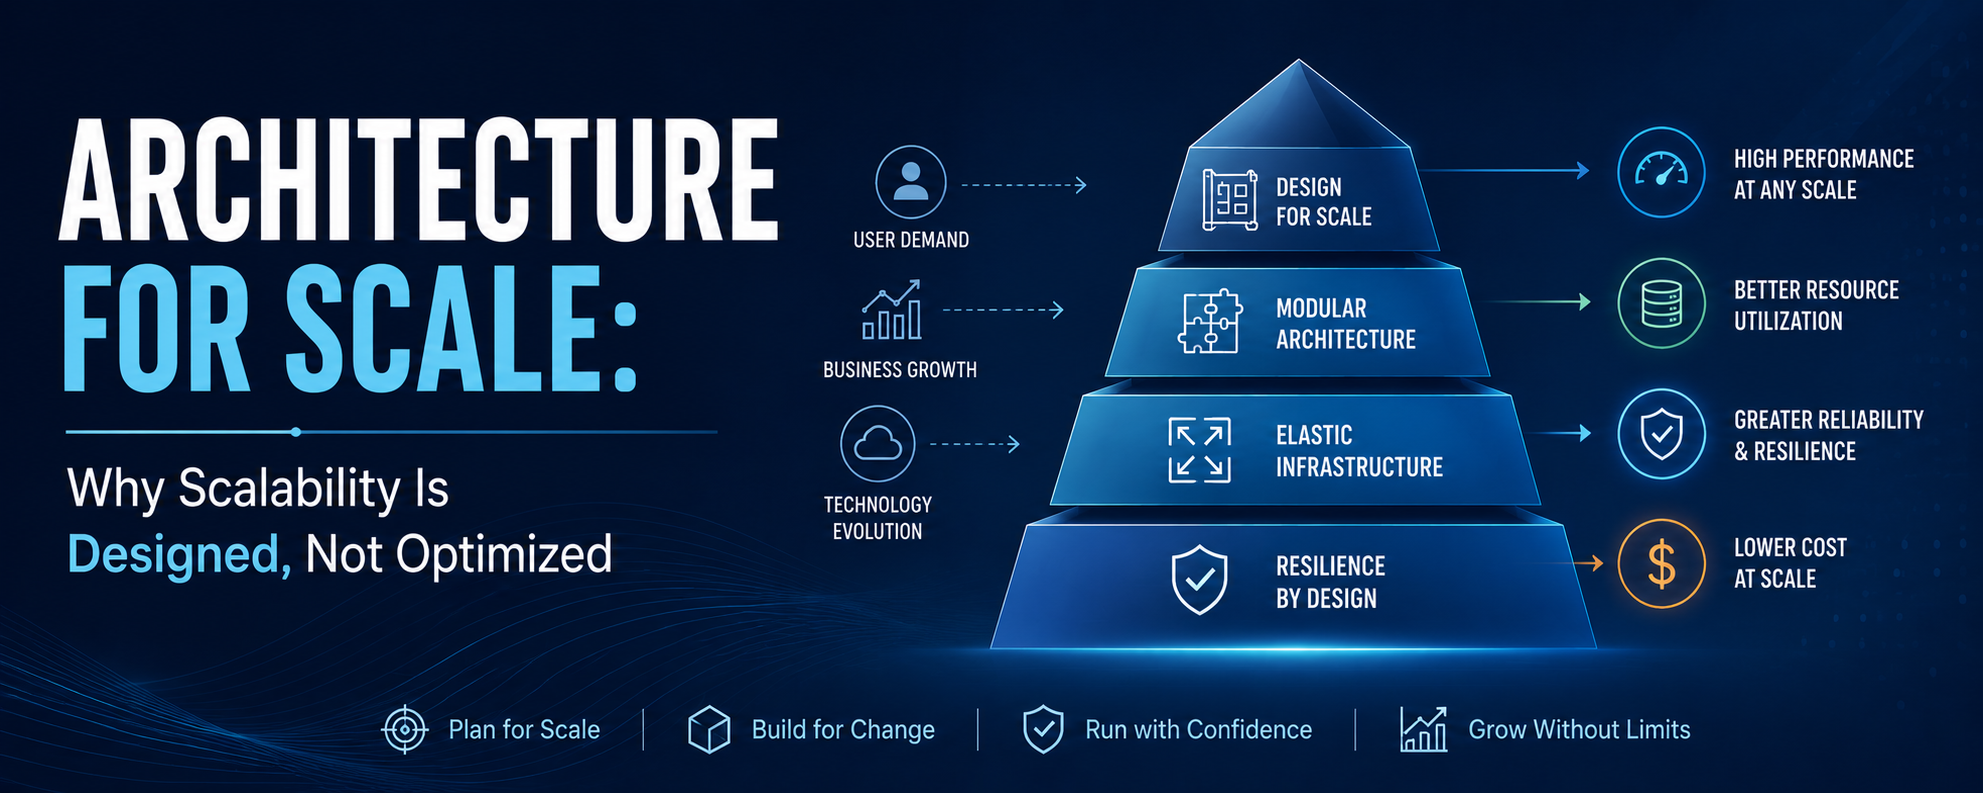
Architecture for Scale: Why Scalability Is Designed, Not Optimized
Suggested next read
The SCALE Framework
Evolve Continuously: Performance Engineering Never Ends
Comments (0)
No comments yet. Be the first!